Your key numbers, live on a wall.
Pushed, not scraped.
One self-contained binary. Your apps POST the numbers — active users, p95, signups, revenue — and upcheckr renders them on a TV-ready wall, live over SSE. No exporters, no scraping, no agents to babysit.
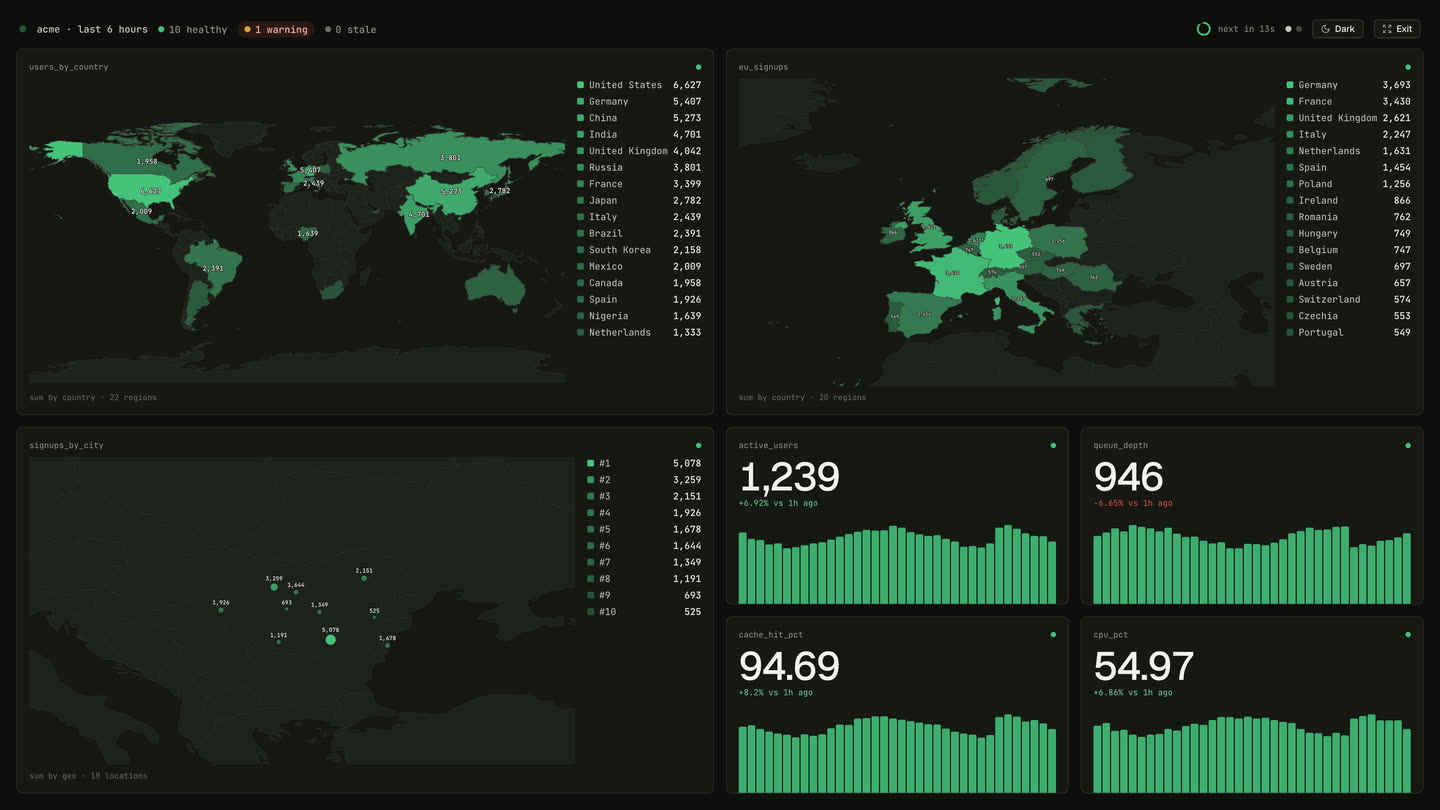
Your team's numbers deserve better than a dashboard no one opens.
Today they live in a Grafana nobody visits, a Datadog bill that scales with your host count, or a spreadsheet someone pastes into on Fridays. upcheckr puts them where the whole team can't miss them — a screen on the wall — without standing up a metrics stack to do it.
Built for a control room.
Enter full-screen wall mode: a chrome-free, dark control-room view that auto-pages across your metric pages with a live countdown ring — “next in 12s” — and a health summary at a glance. No flicker on updates; values animate smoothly as data arrives over Server-Sent Events. Mount it on a TV and leave it on the wall all day.
Your metrics, colored by country.
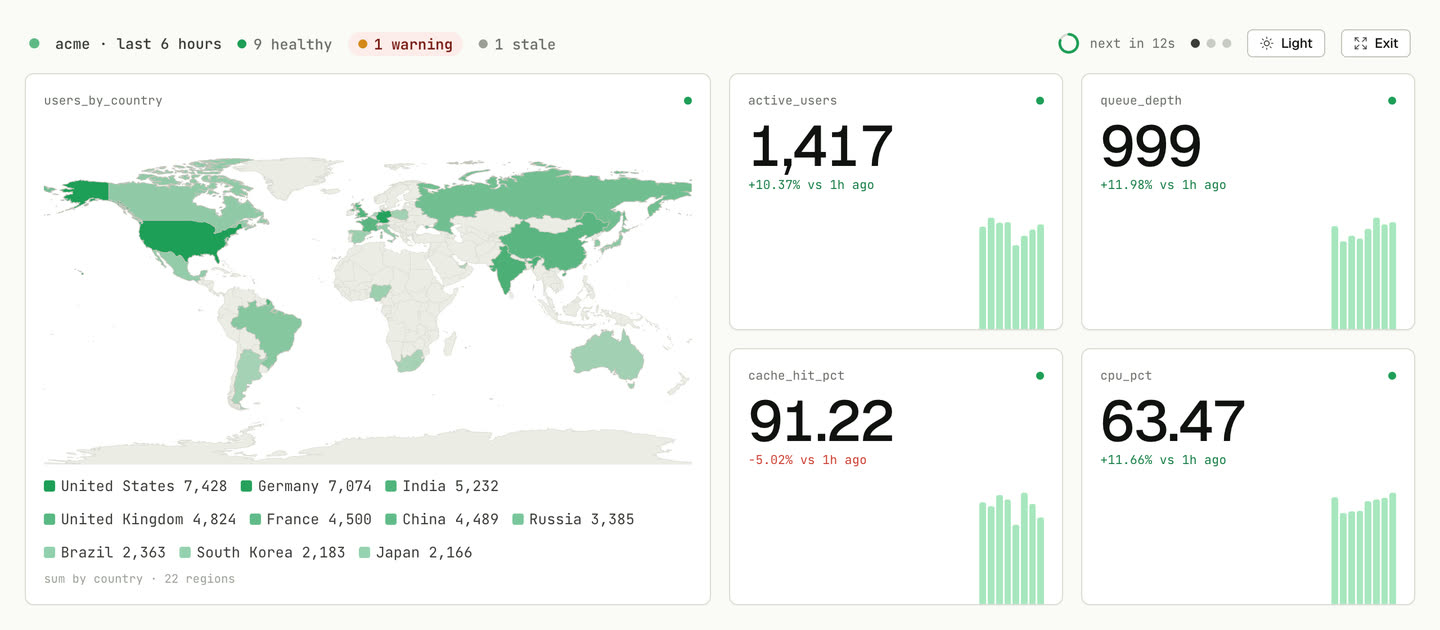
Tag any number with a country label — an ISO-3166 code like DE or US — and upcheckr colors a world map by value. See at a glance which regions run hot. A ranked legend sits beside the map and on-map labels stay readable, never overlapped. Live over Server-Sent Events — no refresh.
Every city, server, or site lights up.
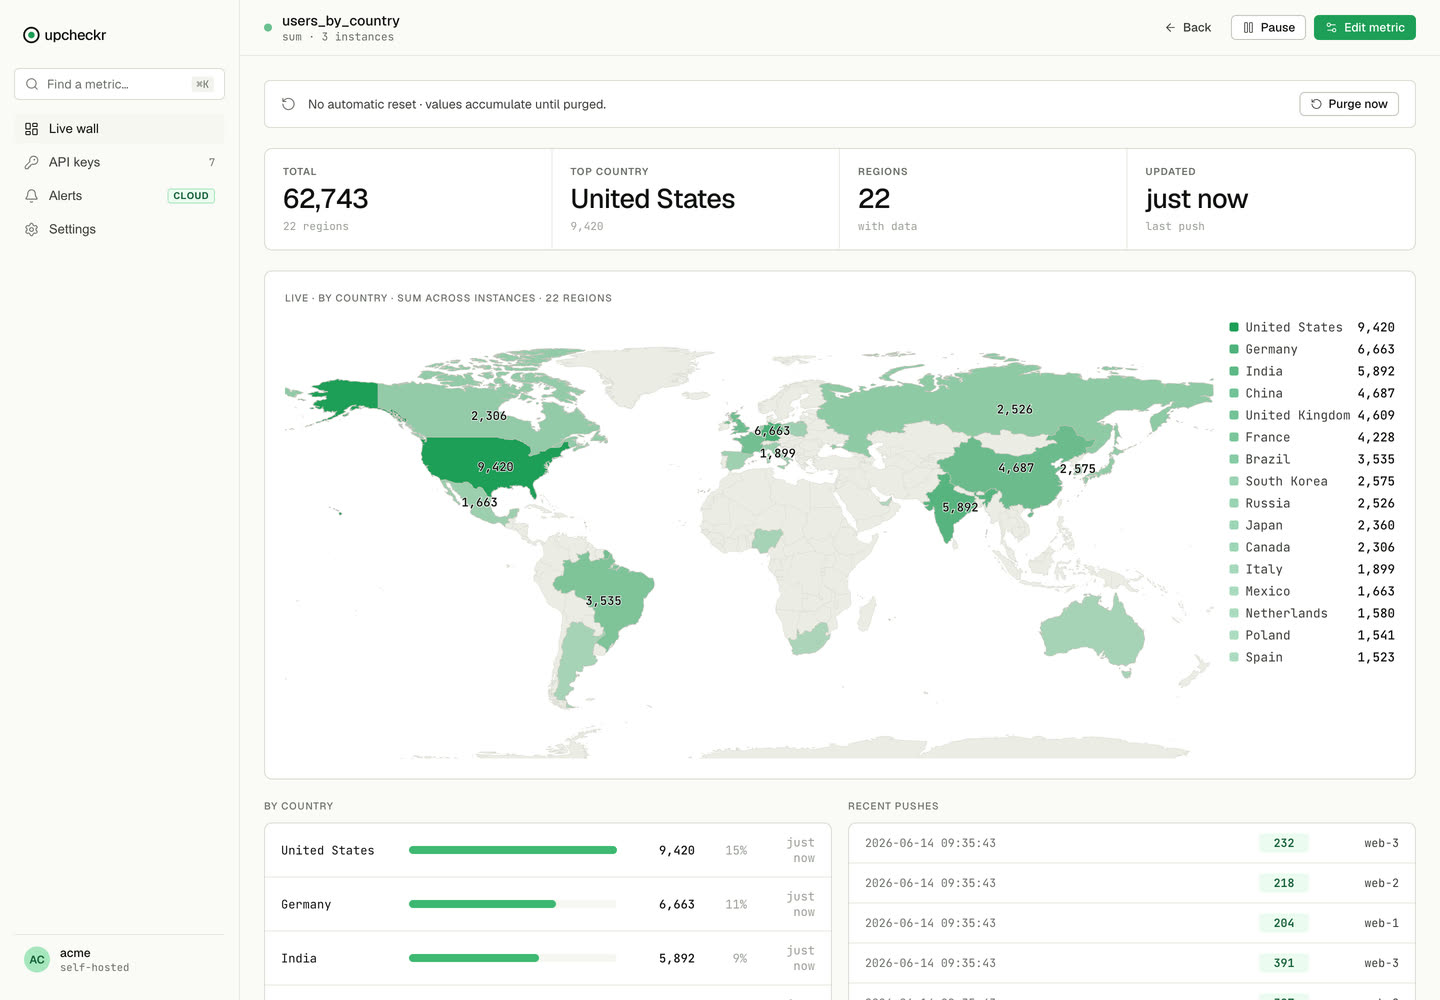
For metrics tagged with coordinates, push a "lat,lng" and every location renders as a value-sized dot that lights up — and the map auto-zooms to your data. Works anywhere on Earth, no per-country map data required. Stores, warehouses, edge servers, cities: see exactly where the numbers are happening, with a ranked legend and a per-point breakdown below.
Drill into any metric.
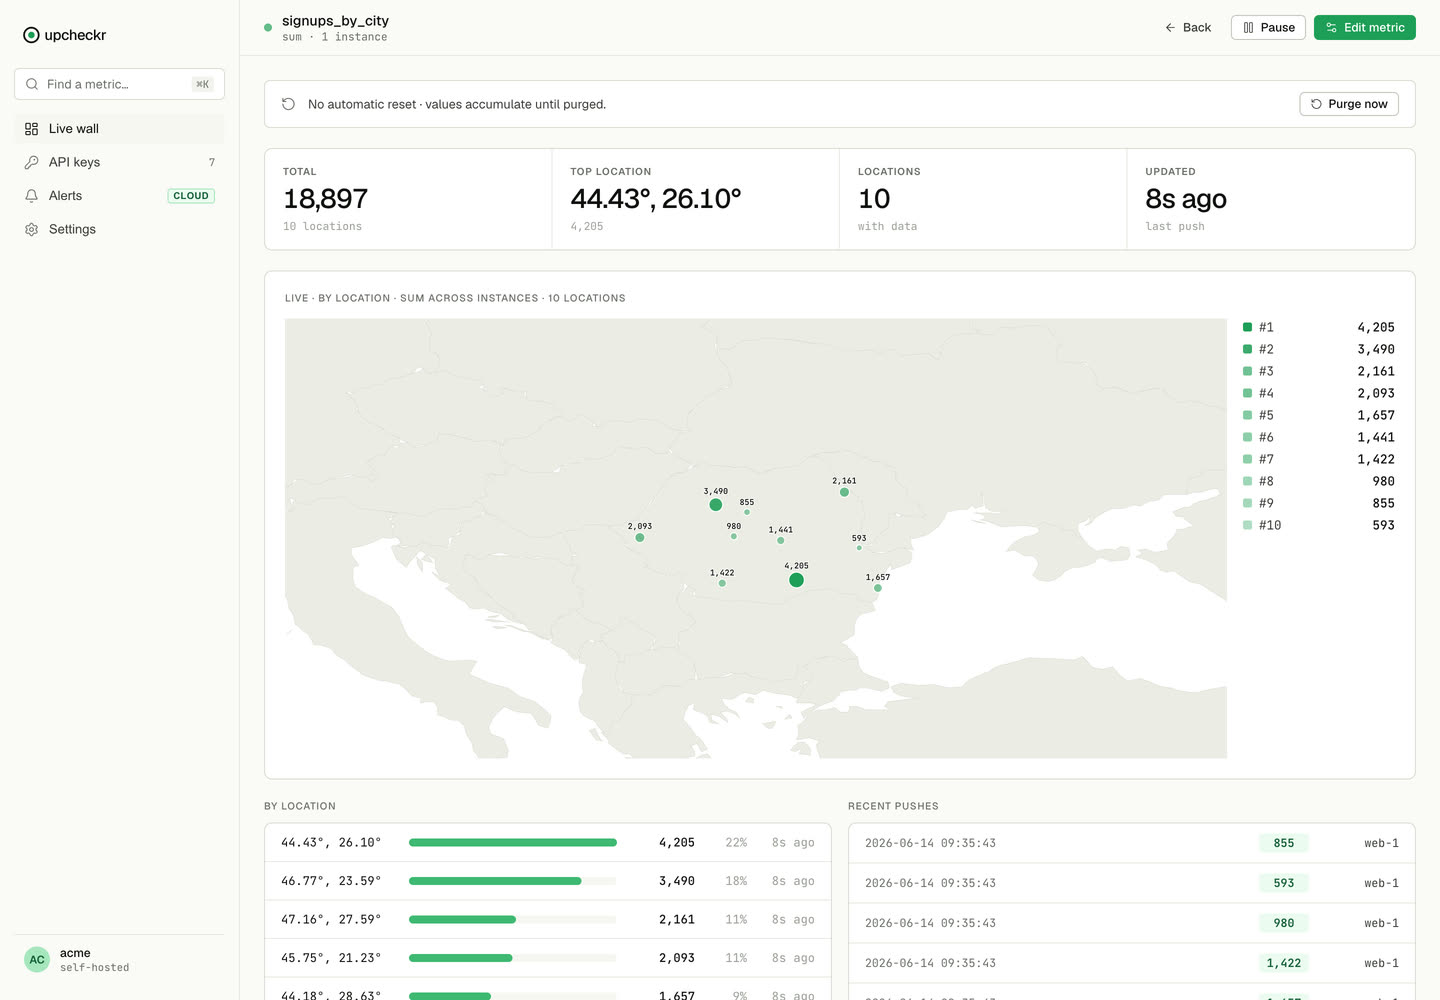
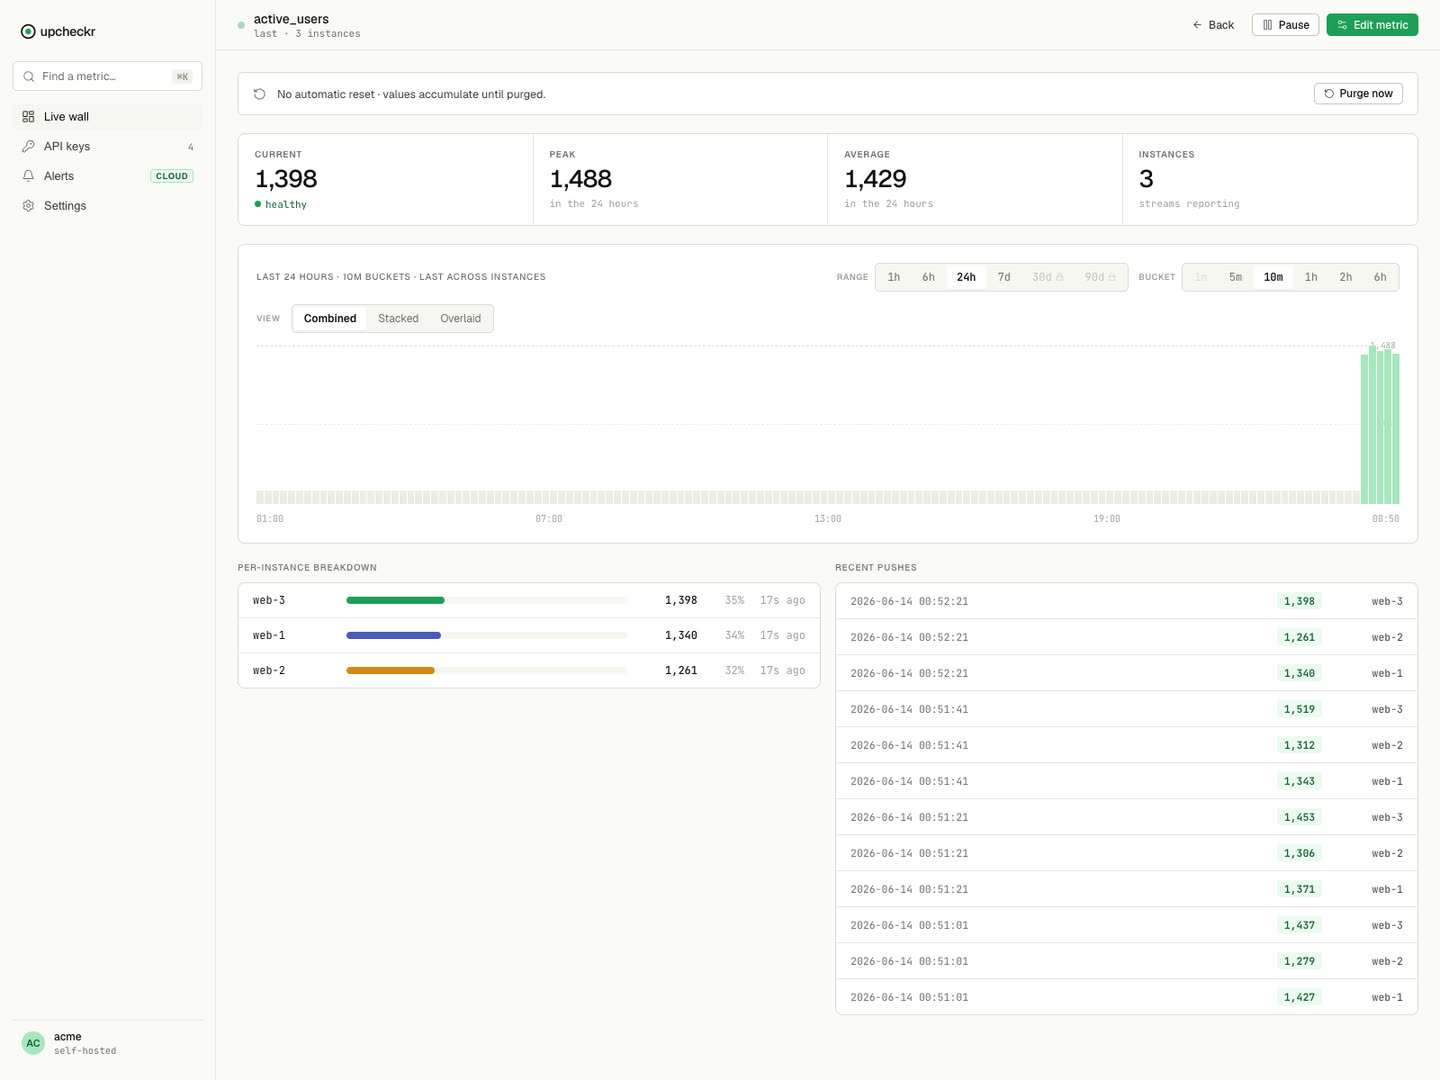
Click any tile for a full detail page: current, peak and 24-hour average across instances, a time-series chart with selectable range (1h to 90d) and bucket (1m to 6h), combined / stacked / overlaid views, a per-instance contribution breakdown, and a live log of every push. For map metrics, the detail page leads with the map and a per-region or per-point breakdown.
You already emit the numbers.
We just put them on the wall.
# emit a live number from anywhere in your app.
curl -X POST https://your-host/api/v1/metrics \
  -H "X-API-Key: acme_prod_…" \
  -d '{"name":"users_by_country","value":52,"instance":"web-1","labels":{"country":"DE"}}'

# → 200 OK · upcheckr recorded it.
# → it's on the wall — and on the map — live.
Push a number
POST a name, a value, an instance — and optionally a label like a country or a lat/lng. No exporters, no scraping, no agents to babysit — just an HTTP call from code you already wrote.
Define what matters
Pick the numbers worth watching and how they roll up — summed, averaged, last-value, or p95 — across every server reporting in, and choose a tile: bars, a number, or a map.
Leave it on the wall
One opinionated page, updating live. Go full-screen for the TV, drill into any metric for detail. A single self-contained binary with SQLite inside — run it anywhere and point a display at it.
Your metrics never leave your machine.
No telemetry, no account
The binary makes no outbound calls — no phone-home, no license check, no analytics. Active users, revenue, latency: business numbers stay on your box, in a local SQLite file you can back up with cp.
Zero-dependency ops
One native binary with SQLite embedded — no database server, no message broker, no JVM to install. Run it on a VPS, a NUC under the TV, or your laptop. Boots in ~30 ms; upgrades are “replace the file”.
Locked down by default
Admin password (BCrypt at rest), reveal-once API keys, CSRF protection, login rate-limiting with lockout, and a capped ingest body. Every download ships with a SHA-256 checksum. Security details →
Simple, like it should be.
- Single self-contained binary
- SQLite inside — no database to run
- Maps, full-screen wall & detail pages
- 7-day retention
- Community support
- Alerting — paged when a metric crosses a line
- 3-month history + off-box backups
- Your branded subdomain
- Stays up so you don’t — priority support
- Fully hosted — zero ops
- Bespoke metric views
- Custom integrations
- On-prem deployment help
- Tailored retention & SLAs